Aly · Annual edition

The Tech Creator Index 2026

Numbers for people who make things online for a living.

A record 5.67 million US business applications in 2025. Here is what the numbers say about going solo, and doing it well.

Every number carries a badge: MeasuredProjectionSurveyAly data What they mean

Numbers 1–3

The door is open

1USMeasured

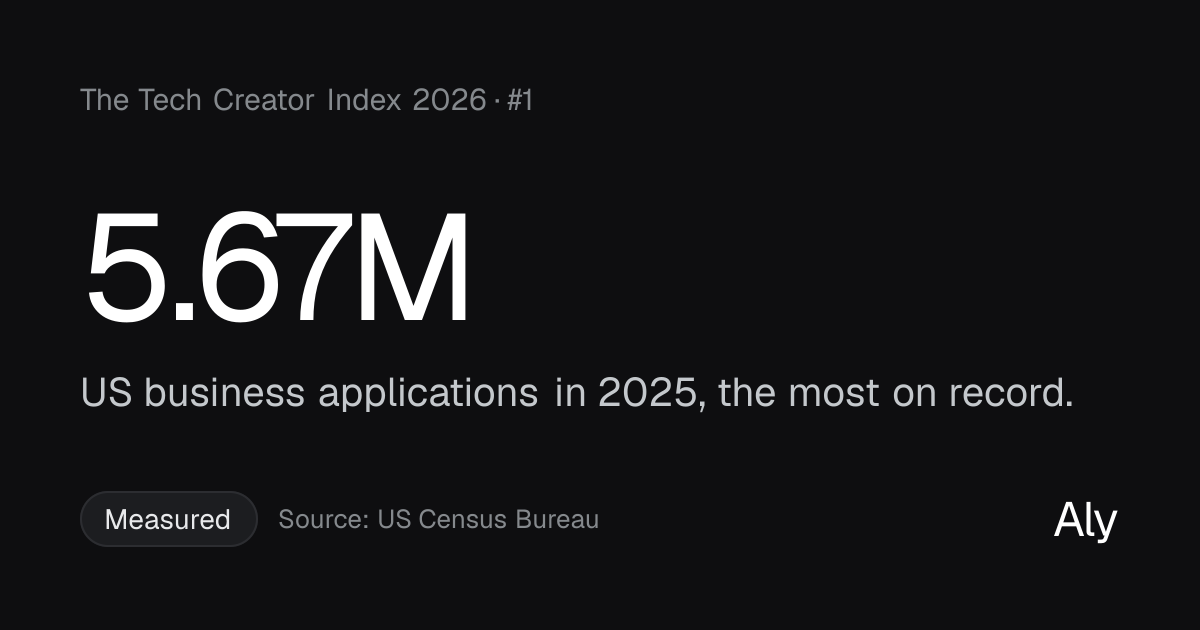
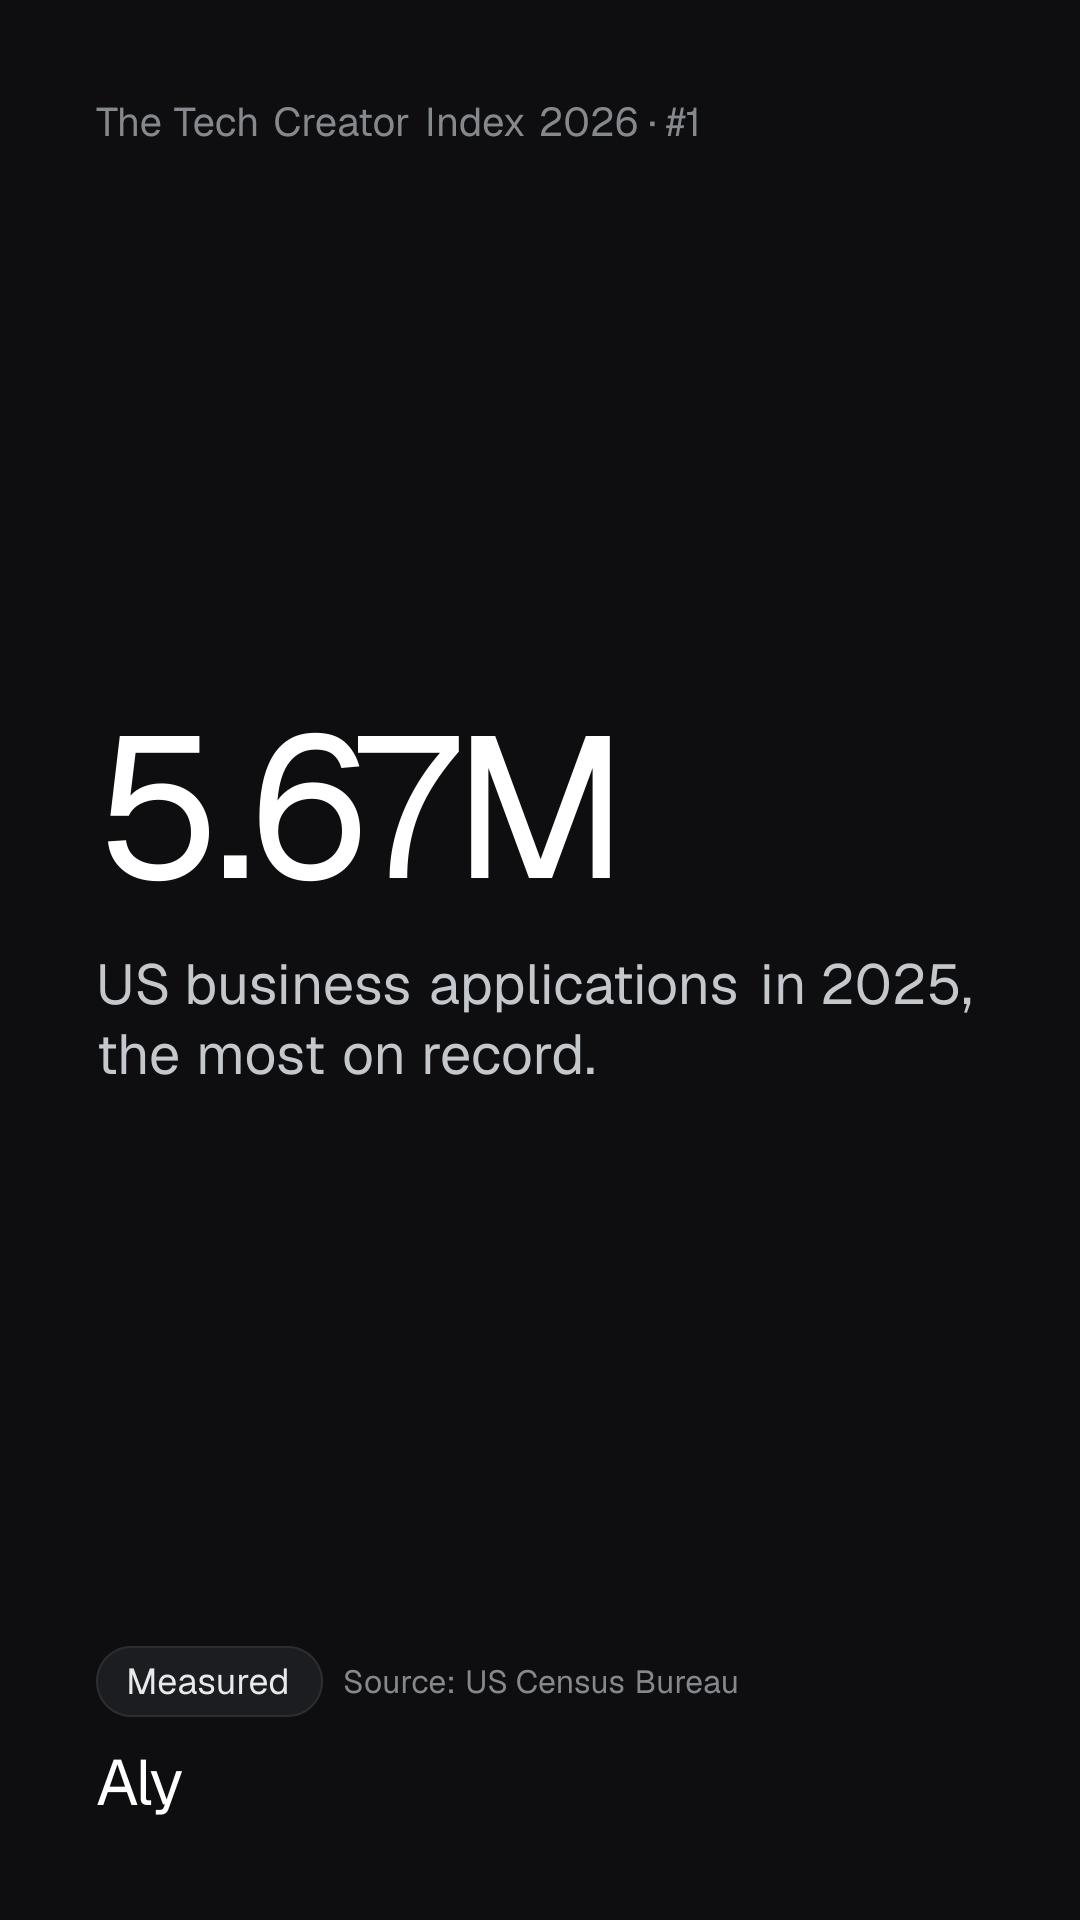
5.67M

US business applications in 2025, the most on record. +62% on 2019. 2026 is running 13.5% ahead of 2025 through August.

In the US, starting something is a normal move now. Canada hasn't seen the same surge.

An application is not a business: many never open.

Source: US Census Bureau · 11 Sep 2026

US business applications per year, 2005–2025, and 2026 through August
2005: 2.49M2.49M20052006: 2.62M2007: 2.63M2008: 2.56M2009: 2.41M2010: 2.47M20102011: 2.55M2012: 2.55M2013: 2.59M2014: 2.69M2015: 2.80M20152016: 2.95M2017: 3.18M2018: 3.49M2019: 3.50M2020: 4.36M20202021: 5.39M2022: 5.06M2023: 5.47M2024: 5.22M2025: 5.67M5.67M20252026 (to Aug): 4.35M
Full year2026, January to August: 4.35M

2020: the pandemic year the climb began

CanadaMeasured

181,263

new employer businesses in Canada in 2025, level with 2019 (181,563). Counting businesses that reopened, 539,909 opened, +6% on 2019.

Counts only businesses with a payroll, so it can't be compared with US applications.

Source: Statistics Canada · 28 Sep 2026

New employer businesses in Canada per year, 2015–2025
2015: 191,089191,08920152016: 190,2142017: 183,6482018: 198,3162019: 181,5632020: 163,17220202021: 192,0222022: 199,2102023: 194,6052024: 190,4102025: 181,263181,2632025
Data and method

United States

US Census Bureau, Business Formation Statistics, 11 Sep 2026. Primary (official statistics).

Computed by Aly: Sum of monthly applications, not seasonally adjusted (series BABATOTALNSAUS).

The count began in 2005.

US business applications per year, 2005–2025, and 2026 through August
YearValue
20052.49M
20062.62M
20072.63M
20082.56M
20092.41M
20102.47M
20112.55M
20122.55M
20132.59M
20142.69M
20152.80M
20162.95M
20173.18M
20183.49M
20193.50M
20204.36M
20215.39M
20225.06M
20235.47M
20245.22M
20255.67M
2026 (to Aug)4.35M

Canada

Statistics Canada, Table 33-10-0270-01, business openings and closures, 28 Sep 2026. Primary (official, experimental series).

Computed by Aly: Sum of monthly entrants and openings, business sector, seasonally adjusted.

Experimental series.

New employer businesses in Canada per year, 2015–2025
YearValue
2015191,089
2016190,214
2017183,648
2018198,316
2019181,563
2020163,172
2021192,022
2022199,210
2023194,605
2024190,410
2025181,263
2USMeasured

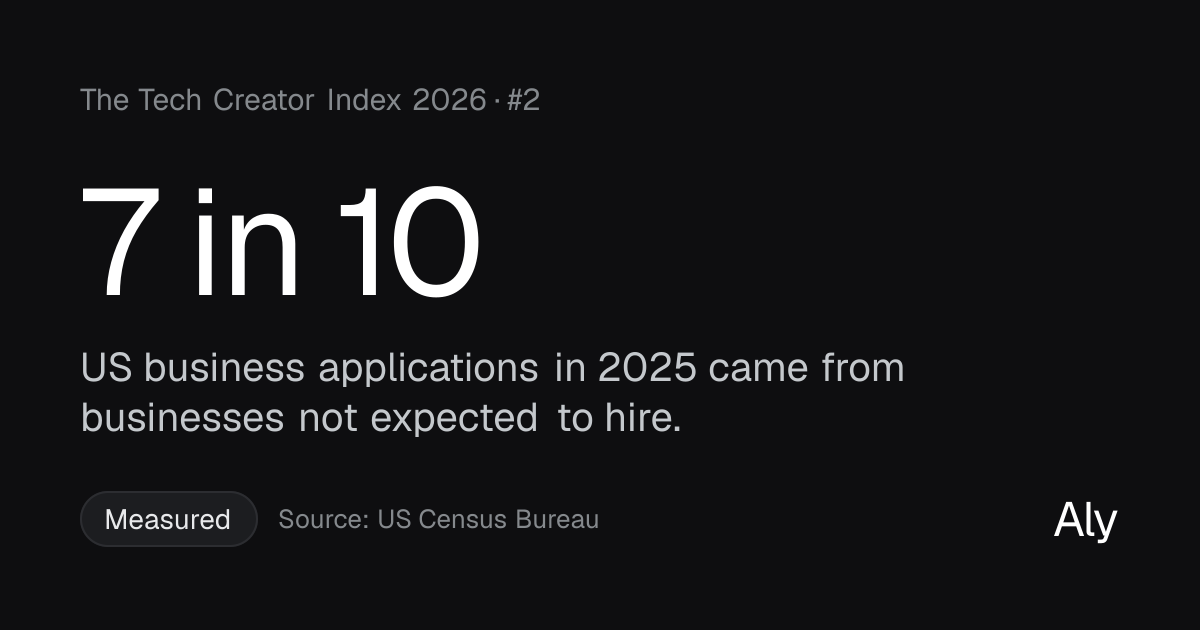
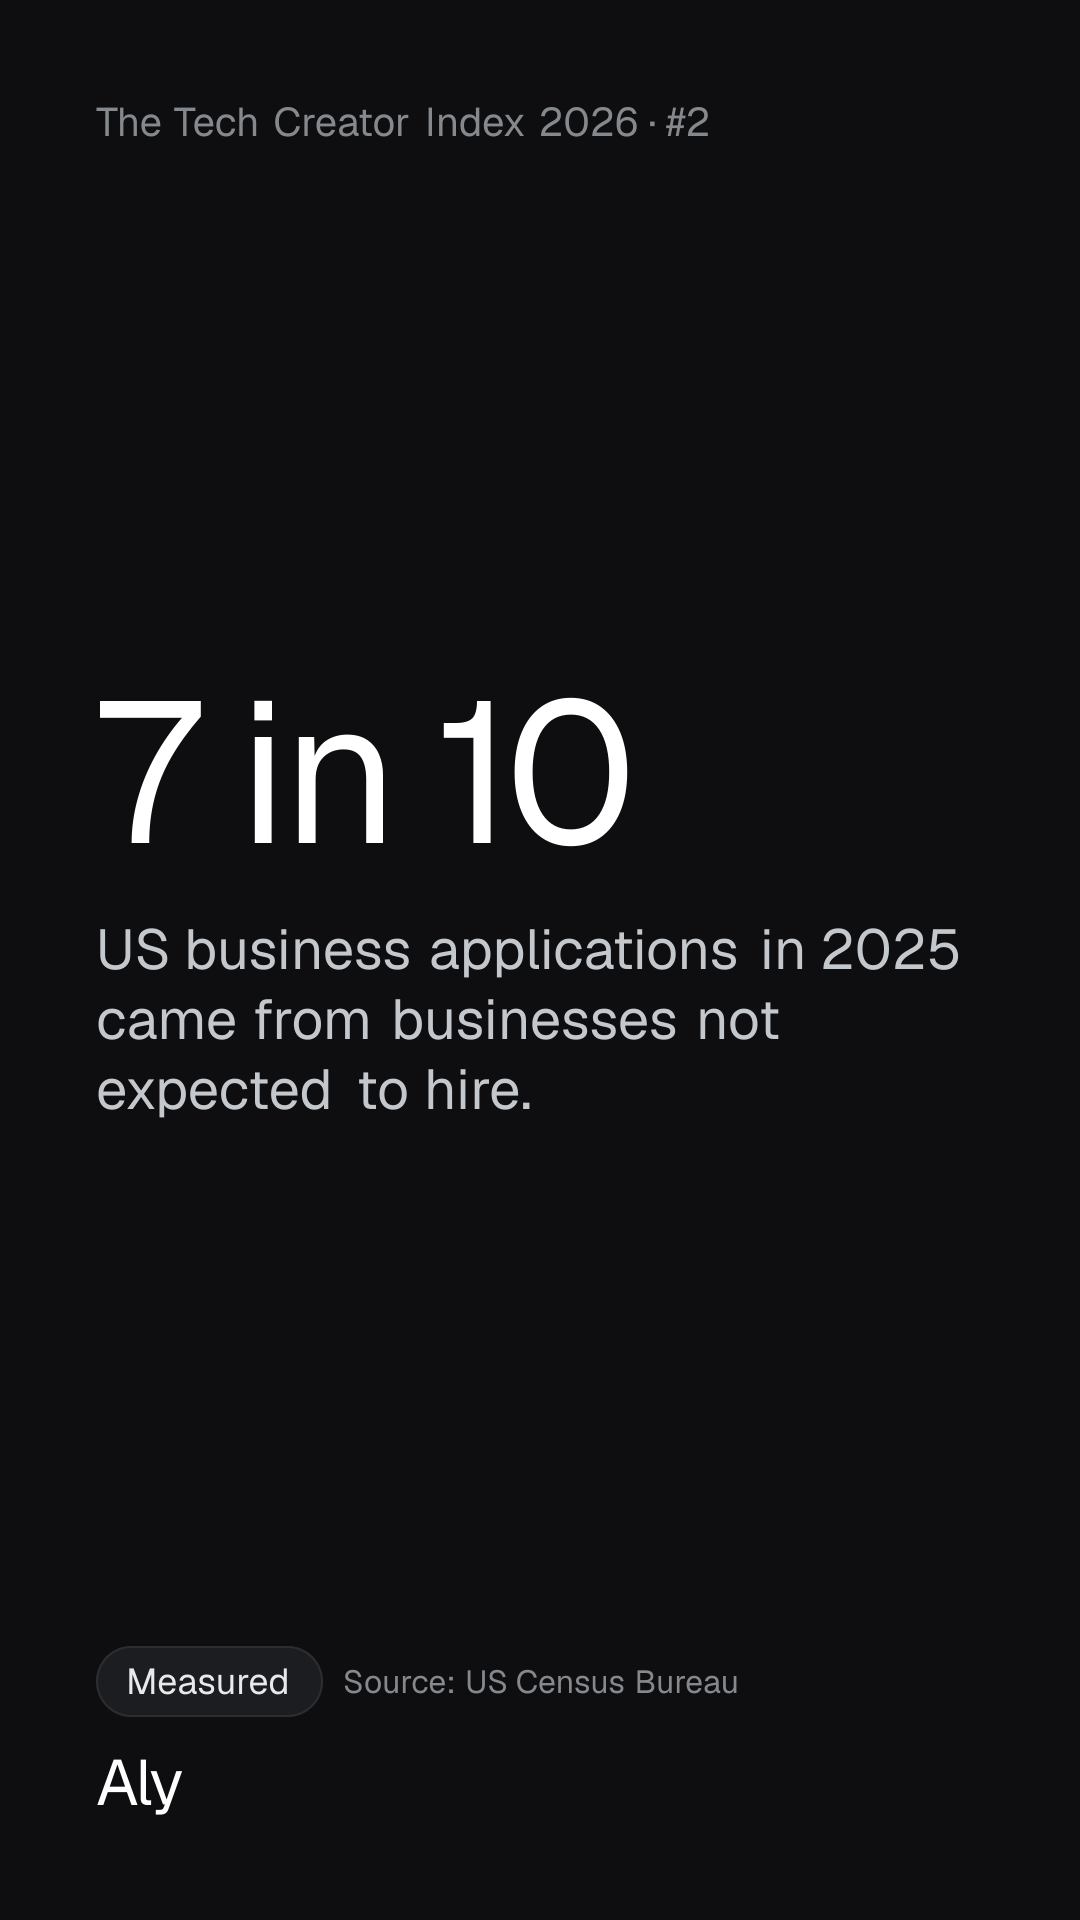
7 in 10

US business applications in 2025 came from businesses not expected to hire. The share expected to hire fell from 37.6% in 2019 to 30.1%.

The boom looks like businesses of one.

Reading these as one-person businesses is Aly's inference: the Census Bureau doesn't count owners.

Source: US Census Bureau · 11 Sep 2026

Share of US business applications by whether the business is expected to hire
20192019, Not expected to hire: 62.4%2019, Expected to hire: 37.6%62.4%37.6%20252025, Not expected to hire: 69.9%2025, Expected to hire: 30.1%69.9%30.1%
Not expected to hireExpected to hire
CanadaMeasured

73%

of Canadian businesses have no employees. 3.78M of 5.15M businesses, June 2026.

A count of all businesses, not of new ones.

Source: Statistics Canada · 14 Aug 2026

Data and method

United States

US Census Bureau, Business Formation Statistics, 11 Sep 2026. Primary (official statistics).

Computed by Aly: Share of high-propensity applications (BAHBATOTALNSAUS) in all applications (BABATOTALNSAUS), annual sums.

Share of US business applications by whether the business is expected to hire
YearNot expected to hireExpected to hire
201962.4%37.6%
202569.9%30.1%

Canada

Statistics Canada, Canadian Business Counts, June 2026, 14 Aug 2026. Primary (official statistics).

Computed by Aly: Non-employer share of all businesses (33-10-1175-01 over both tables).

Businesses with over $30,000 in revenue, counted by location.

3USMeasured

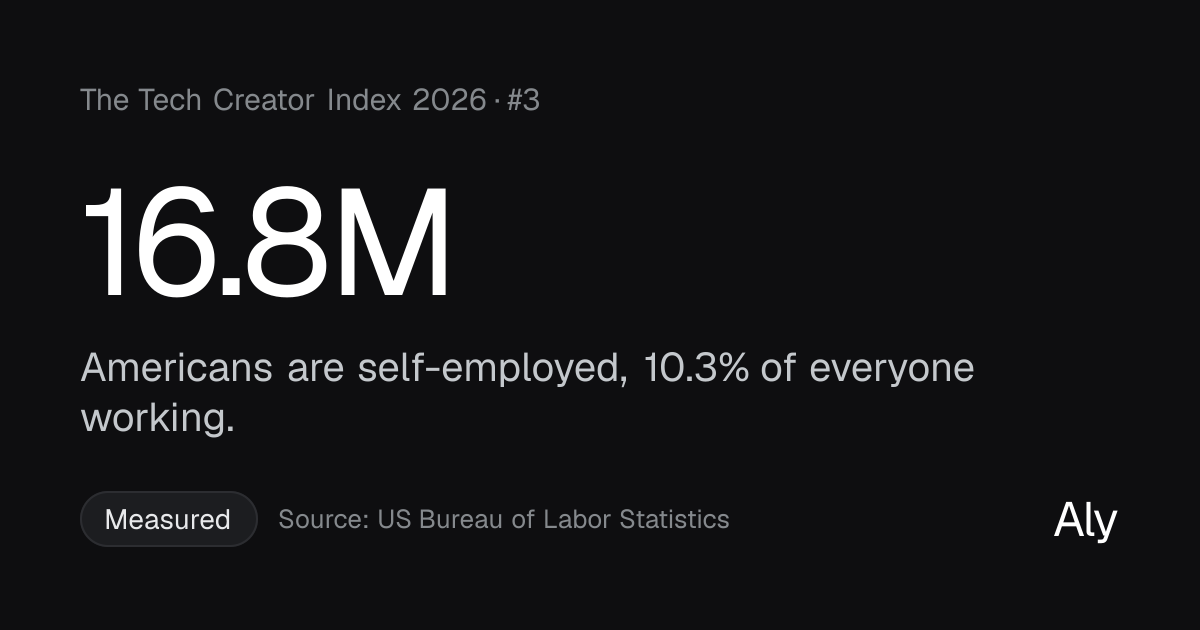
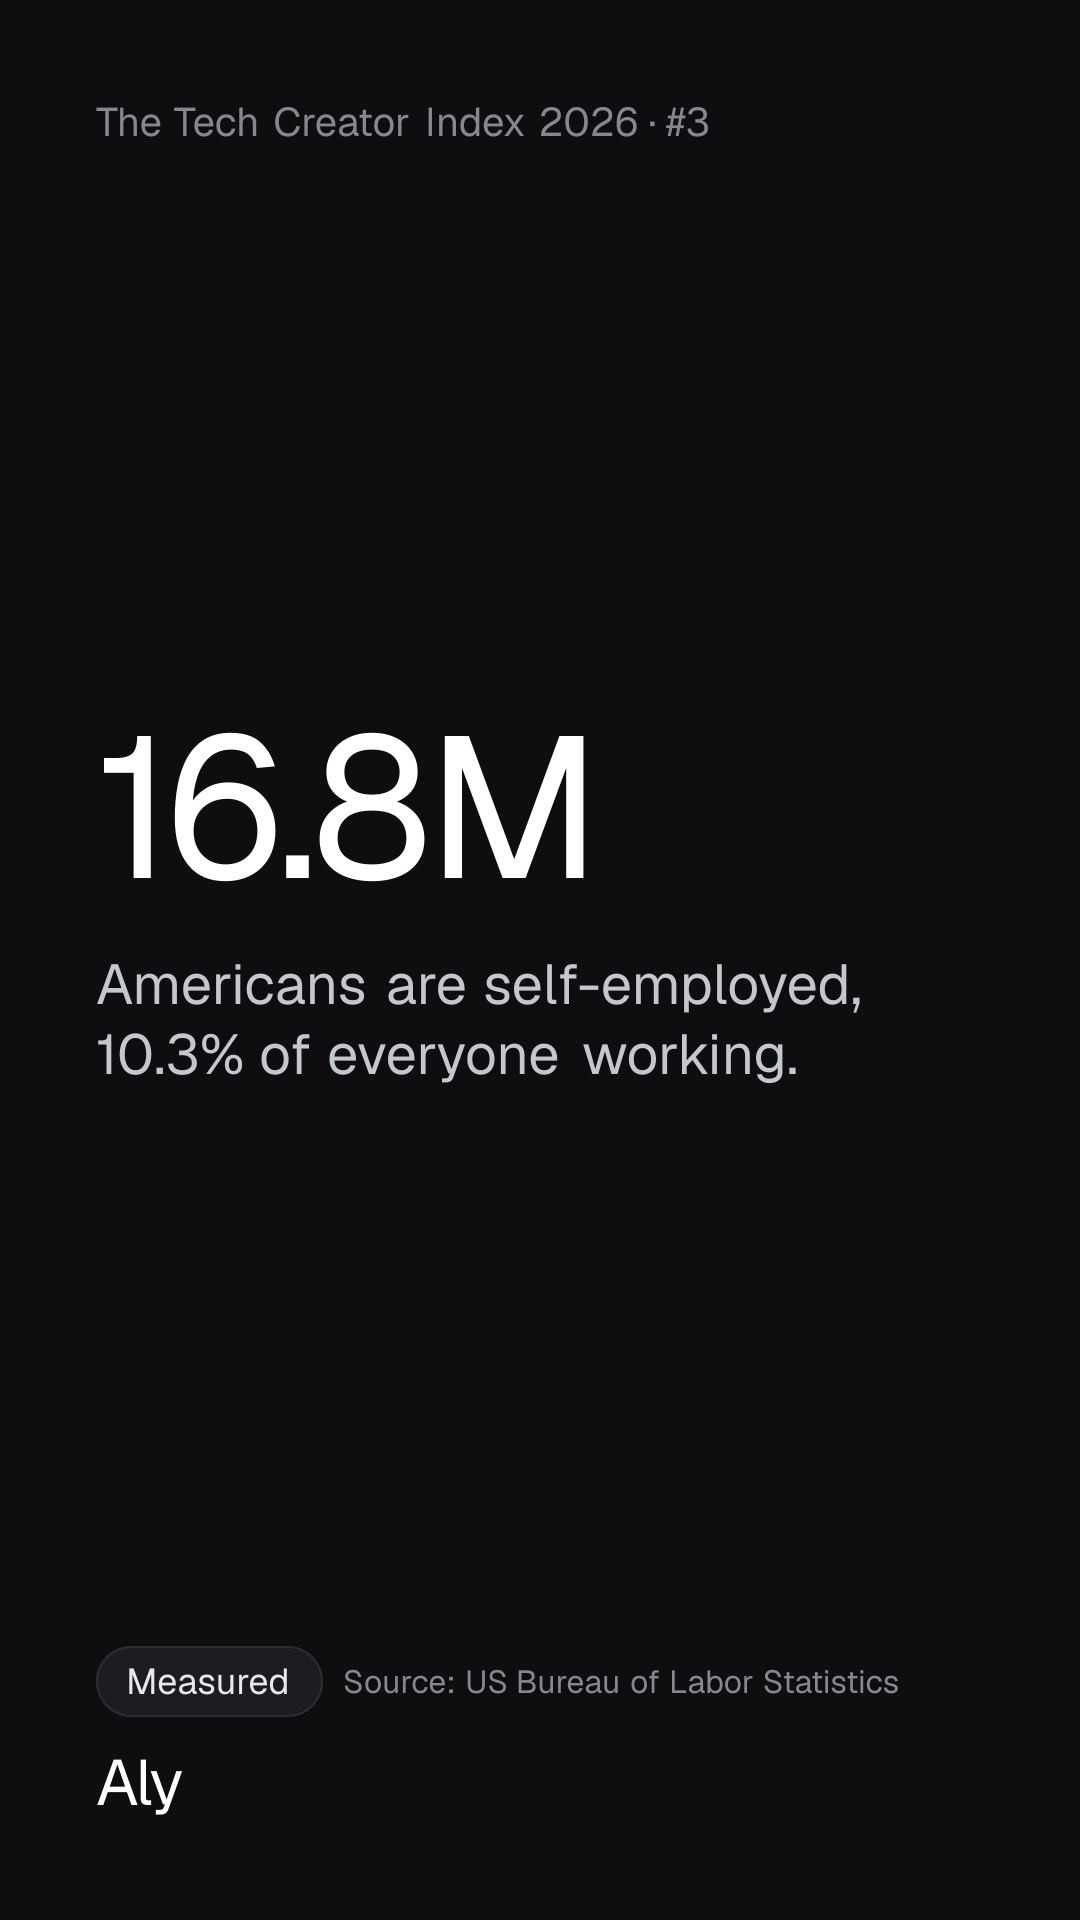
16.8M

Americans are self-employed, 10.3% of everyone working. Those who incorporated are up 12% since 2019, against 3.8% for all jobs.

More Americans run their work like a company. In Canada, fewer work for themselves.

Main job only, so side hustles aren't counted.

Source: US Bureau of Labor Statistics · data to Sep 2026, read 10 Oct 2026

United States, indexed to 2019 = 100
9010011520192025All jobs: 2019 100.0, 2020 93.8, 2021 96.9, 2022 100.5, 2023 102.2, 2024 102.4, 2025 103.8All jobs103.8Unincorporated: 2019 100.0, 2020 97.0, 2021 104.4, 2022 103.5, 2023 102.0, 2024 104.0, 2025 103.1Unincorporated103.1Incorporated: 2019 100.0, 2020 101.6, 2021 98.9, 2022 107.6, 2023 108.1, 2024 110.3, 2025 112.2Incorporated112.2
IncorporatedUnincorporatedAll jobs
CanadaMeasured

2.71M

Canadians are self-employed, 12.9% of workers, down from 14.7% in 2019. Incorporated: +1.7% since 2019, against +10.3% for all jobs.

The share was 16.1% in 2000.

Source: Statistics Canada · 9 Jan 2026

Canada, indexed to 2019 = 100
9010011520192025All jobs: 2019 100.0, 2020 94.7, 2021 99.4, 2022 103.5, 2023 106.6, 2024 108.7, 2025 110.3All jobs110.3Unincorporated: 2019 100.0, 2020 100.1, 2021 95.4, 2022 93.5, 2023 91.0, 2024 91.2, 2025 92.0Unincorporated92.0Incorporated: 2019 100.0, 2020 93.7, 2021 93.2, 2022 94.0, 2023 98.7, 2024 100.1, 2025 101.7Incorporated101.7
IncorporatedUnincorporatedAll jobs
Data and method

United States

US Bureau of Labor Statistics, Current Population Survey, data to Sep 2026, read 10 Oct 2026. Primary (official statistics).

Computed by Aly: Annual average of monthly, not seasonally adjusted series LNU02048984, LNU02027714 and LNU02000000.

The 2025 average covers 11 months: the series has no October 2025 estimate.

United States, indexed to 2019 = 100
Series2019202020212022202320242025
Incorporated100.0101.698.9107.6108.1110.3112.2
Unincorporated100.097.0104.4103.5102.0104.0103.1
All jobs100.093.896.9100.5102.2102.4103.8

Canada

Statistics Canada, Labour Force Survey, table 14-10-0027-01, 9 Jan 2026. Primary (official statistics).

Computed by Aly: Incorporated and unincorporated, with and without paid help, summed.

Solo workers with no paid help barely moved.

Canada, indexed to 2019 = 100
Series2019202020212022202320242025
Incorporated100.093.793.294.098.7100.1101.7
Unincorporated100.0100.195.493.591.091.292.0
All jobs100.094.799.4103.5106.6108.7110.3

Numbers 4–6

The money is moving to creators

4USProjection

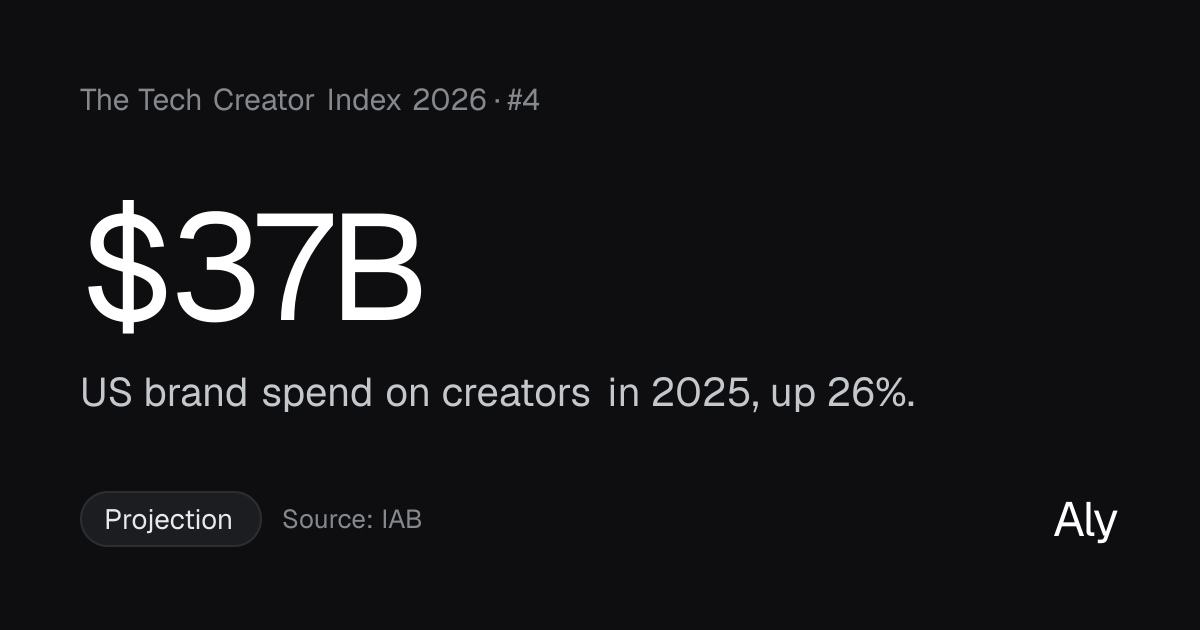
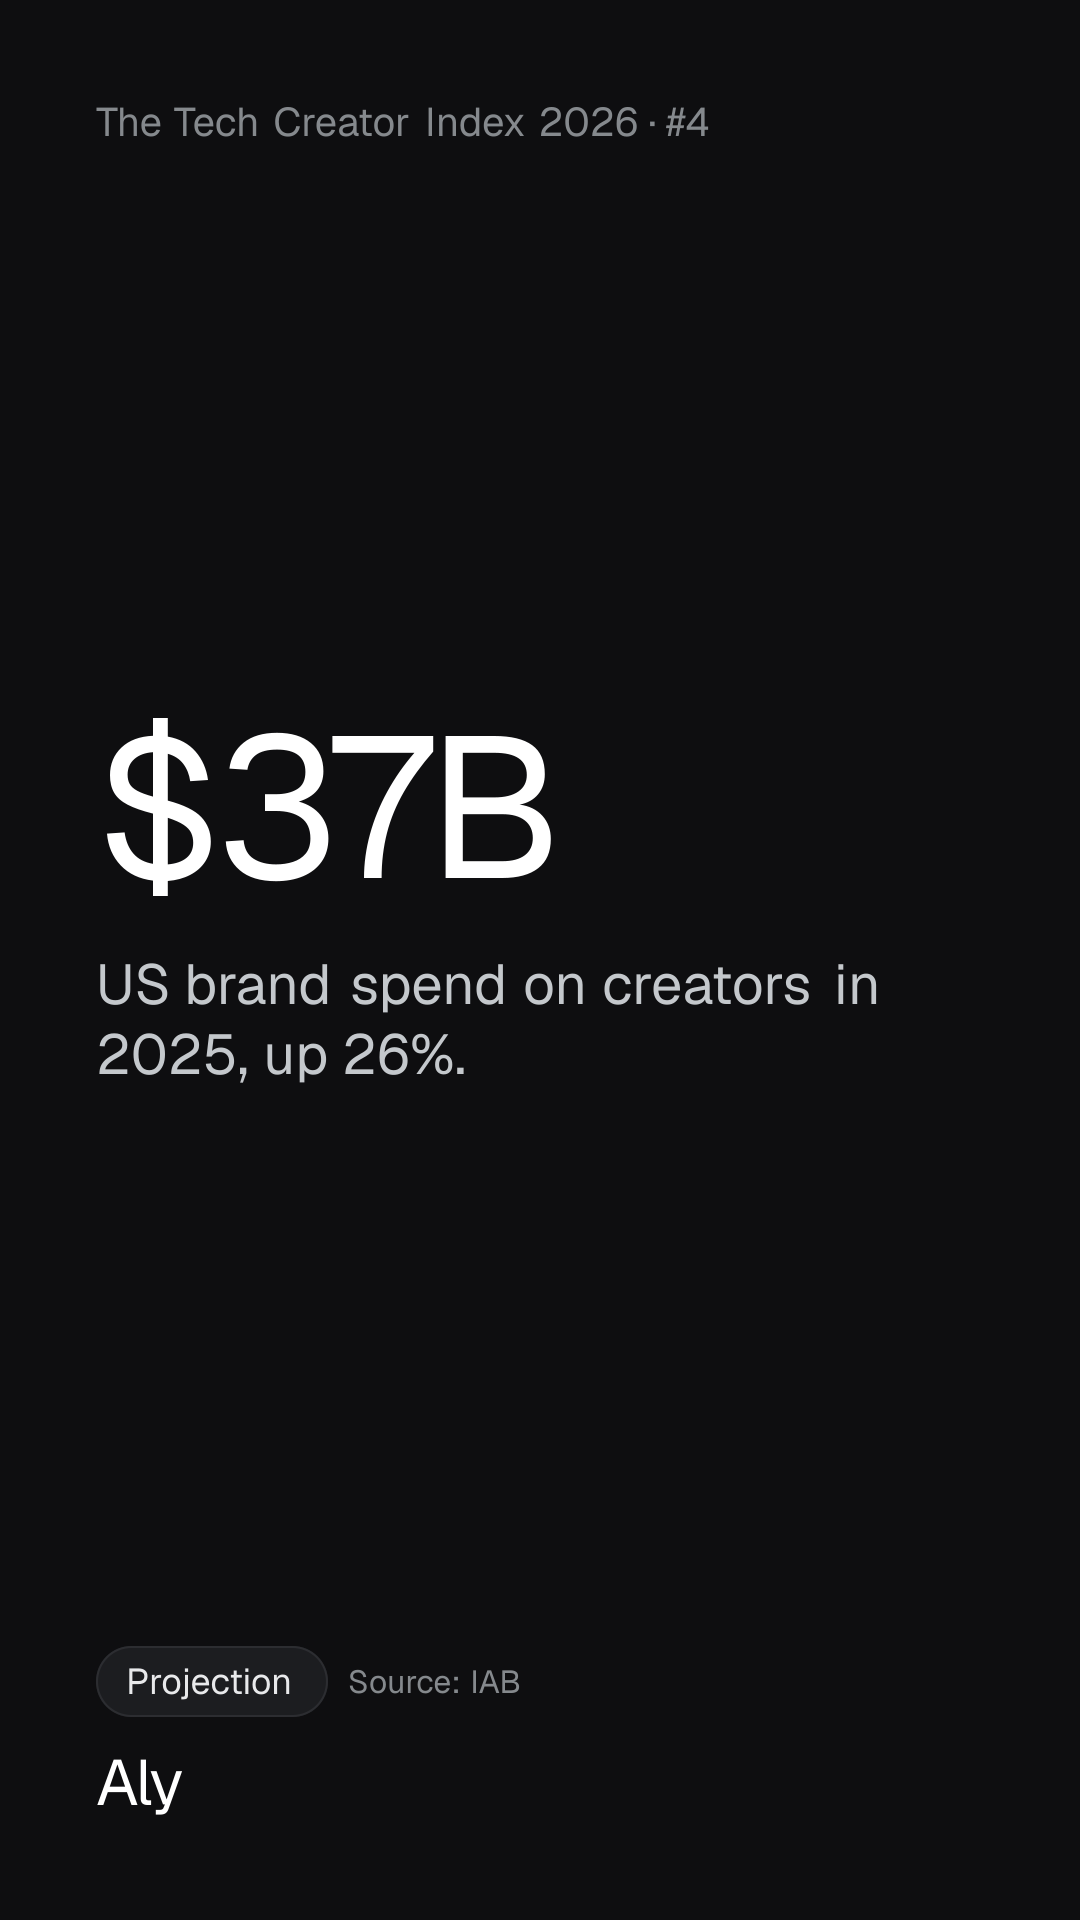
$37B

US brand spend on creators in 2025, up 26%. About 4× the growth of media overall (5.7%). IAB expects $44B in 2026. 2022 and 2023 aren't published.

Brands now treat creators as a channel, not a test.

Brand money for sponsored content only: no affiliate, subscriptions, tips or merch.

Source: IAB · 20 Nov 2025

Canada No comparable Canadian figure is published. The one we found is a model estimate, so it isn't here.

US brand spend on creators, US$ billions
2021: $13.9B$13.9B2021202220232024: $29.5B$29.5B20242025: $37B$37B20252026: $44B$44B2026
EstimateProjection
Data and method

IAB, 2025 Creator Economy Ad Spend & Strategy Report, 20 Nov 2025. Secondary (trade-body model and buyer survey).

2025 was projected in November 2025.

US brand spend on creators, US$ billions
YearValue
2021$13.9B
2022Not published
2023Not published
2024$29.5B
2025$37B
2026$44B
5WorldwideMeasured

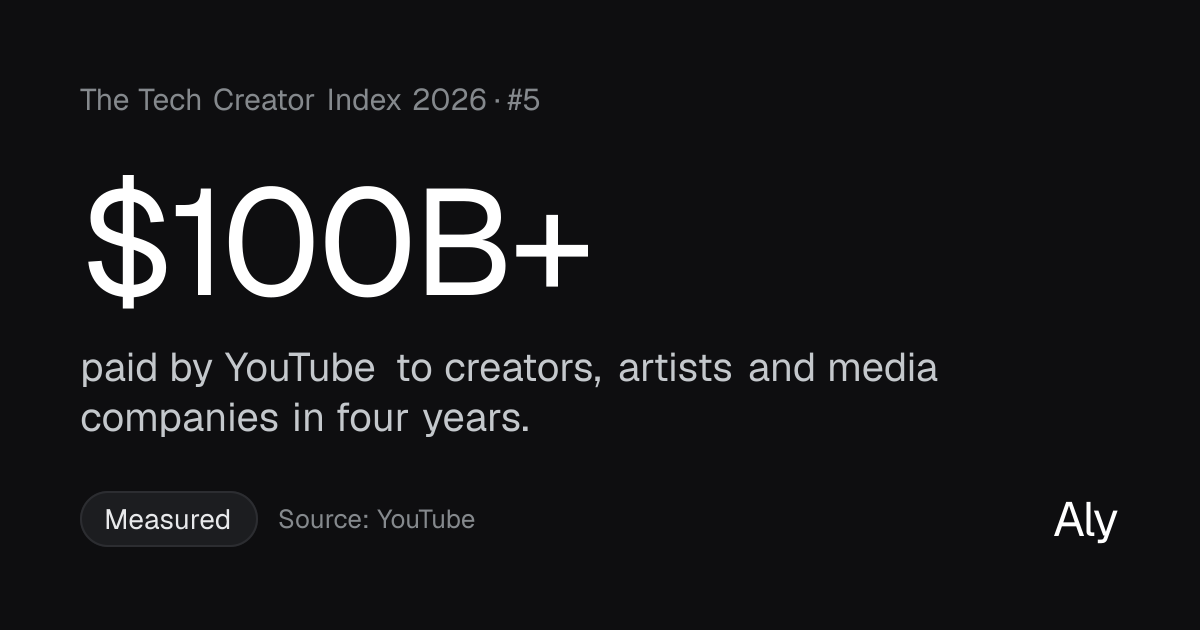
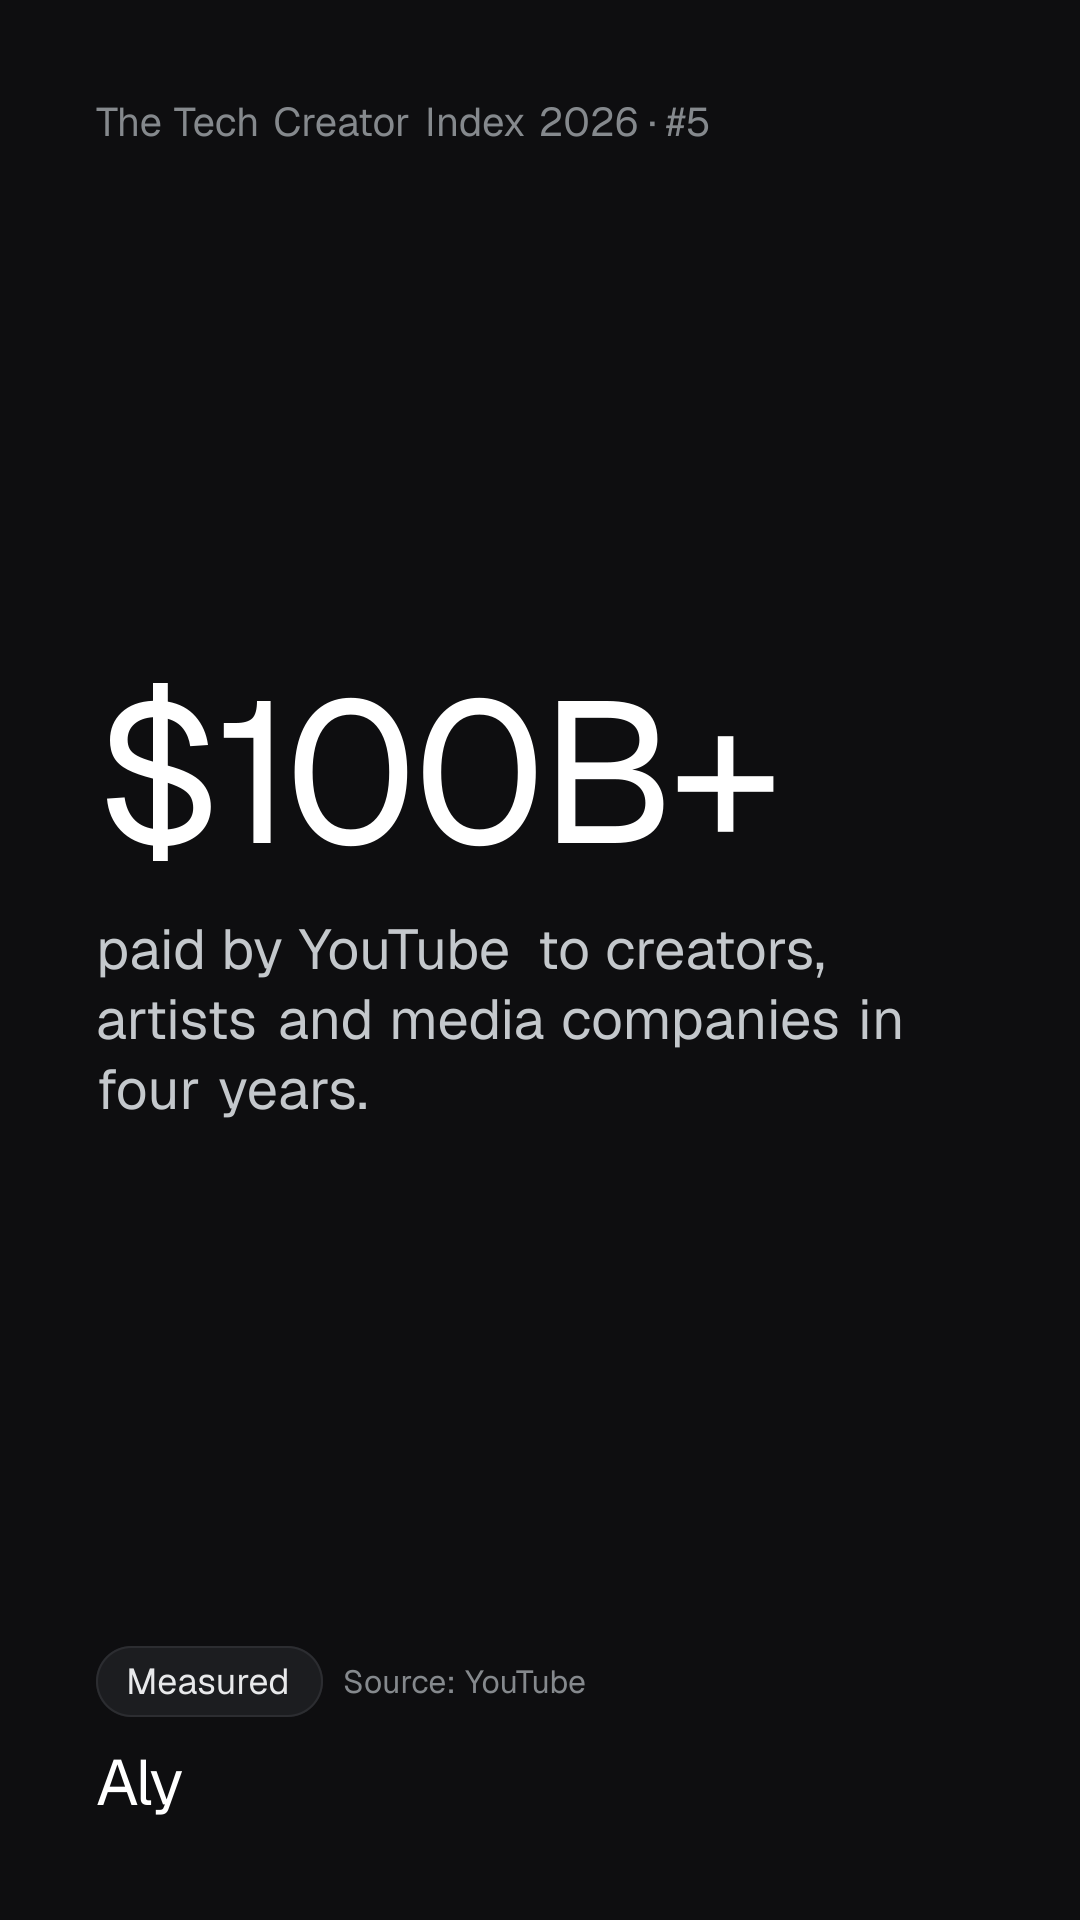
$100B+

paid by YouTube to creators, artists and media companies in four years.

The platforms pay out at scale.

Includes record labels and media companies, not only independent creators.

Source: YouTube · 21 Jan 2026

Data and method

YouTube, Neal Mohan's 2026 letter to creators, 21 Jan 2026. Primary (company disclosure), via Tubefilter.

6WorldwideMeasured

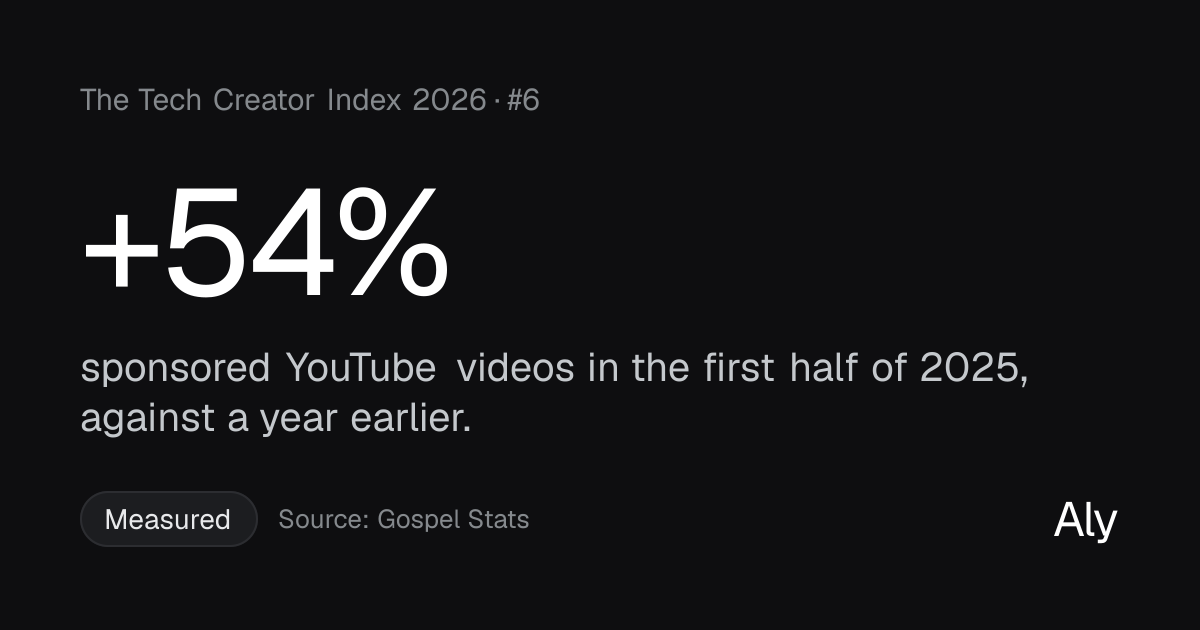
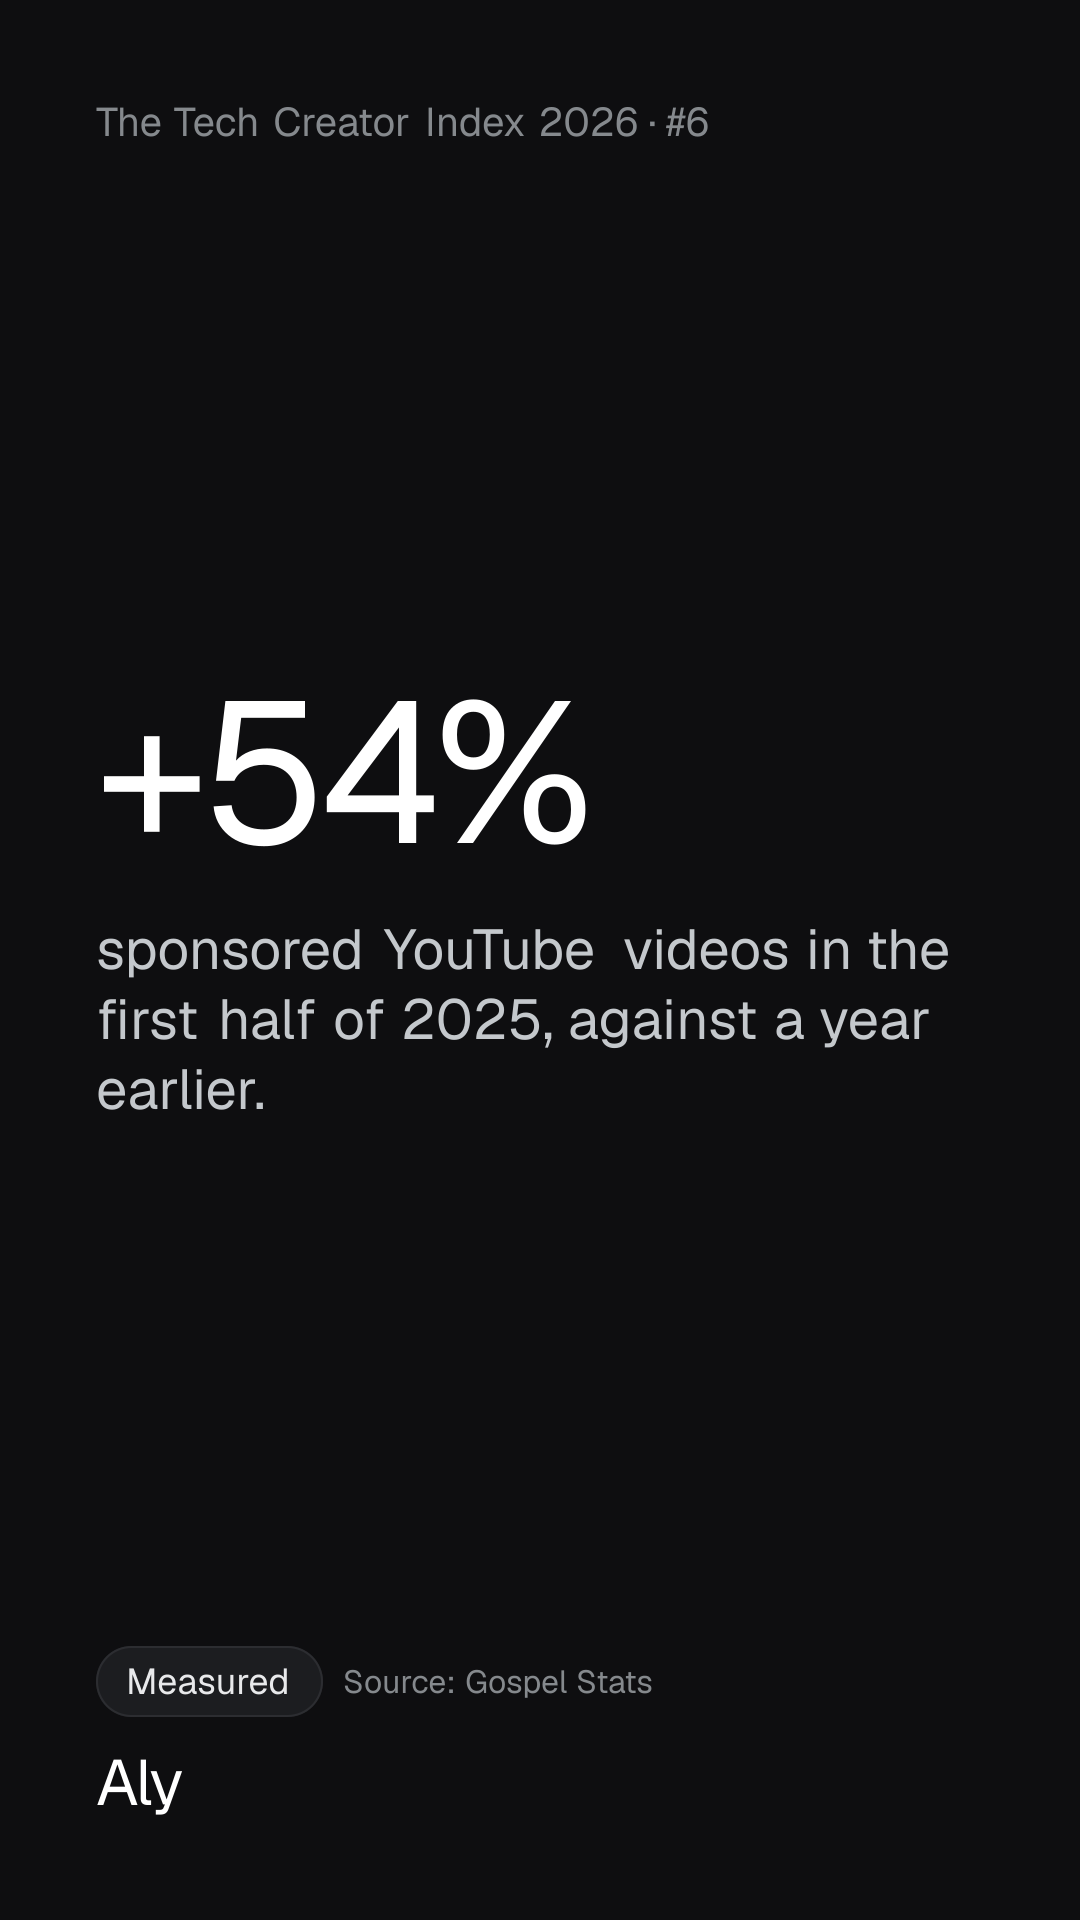
+54%

sponsored YouTube videos in the first half of 2025, against a year earlier. 65,759 videos, “nearly 54%” more. Channels averaging 100K–500K views a video drove much of it.

The growth is in the middle, not only at the top.

How sponsorships are detected isn't disclosed.

Source: Gospel Stats · 22 Oct 2025

Sponsored YouTube videos, first half of the year, 2024 = 100
H1 2024H1 2024: 100100H1 2025H1 2025: 154 (65,759 videos)154 (65,759 videos)
Data and method

Gospel Stats, YouTube Sponsorship Landscape Report, 22 Oct 2025. Vendor data, via Tubefilter.

Sponsored YouTube videos, first half of the year, 2024 = 100
Value
H1 2024100
H1 2025154 (65,759 videos)

Numbers 7–8

Tech is the hottest beat

7WorldwideMeasured

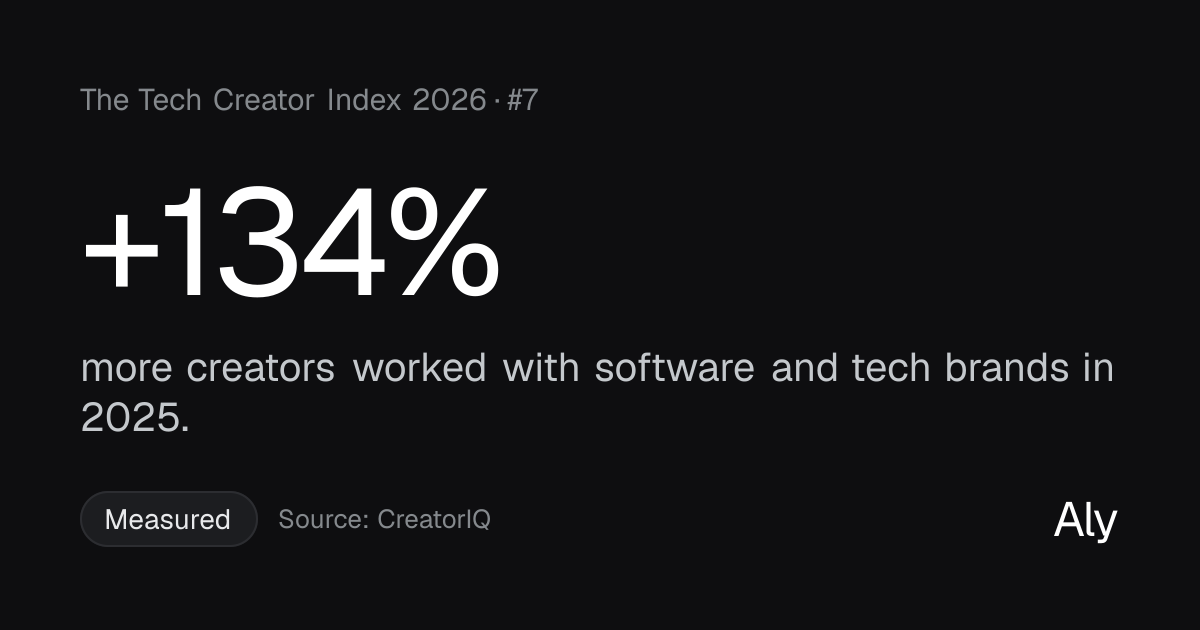
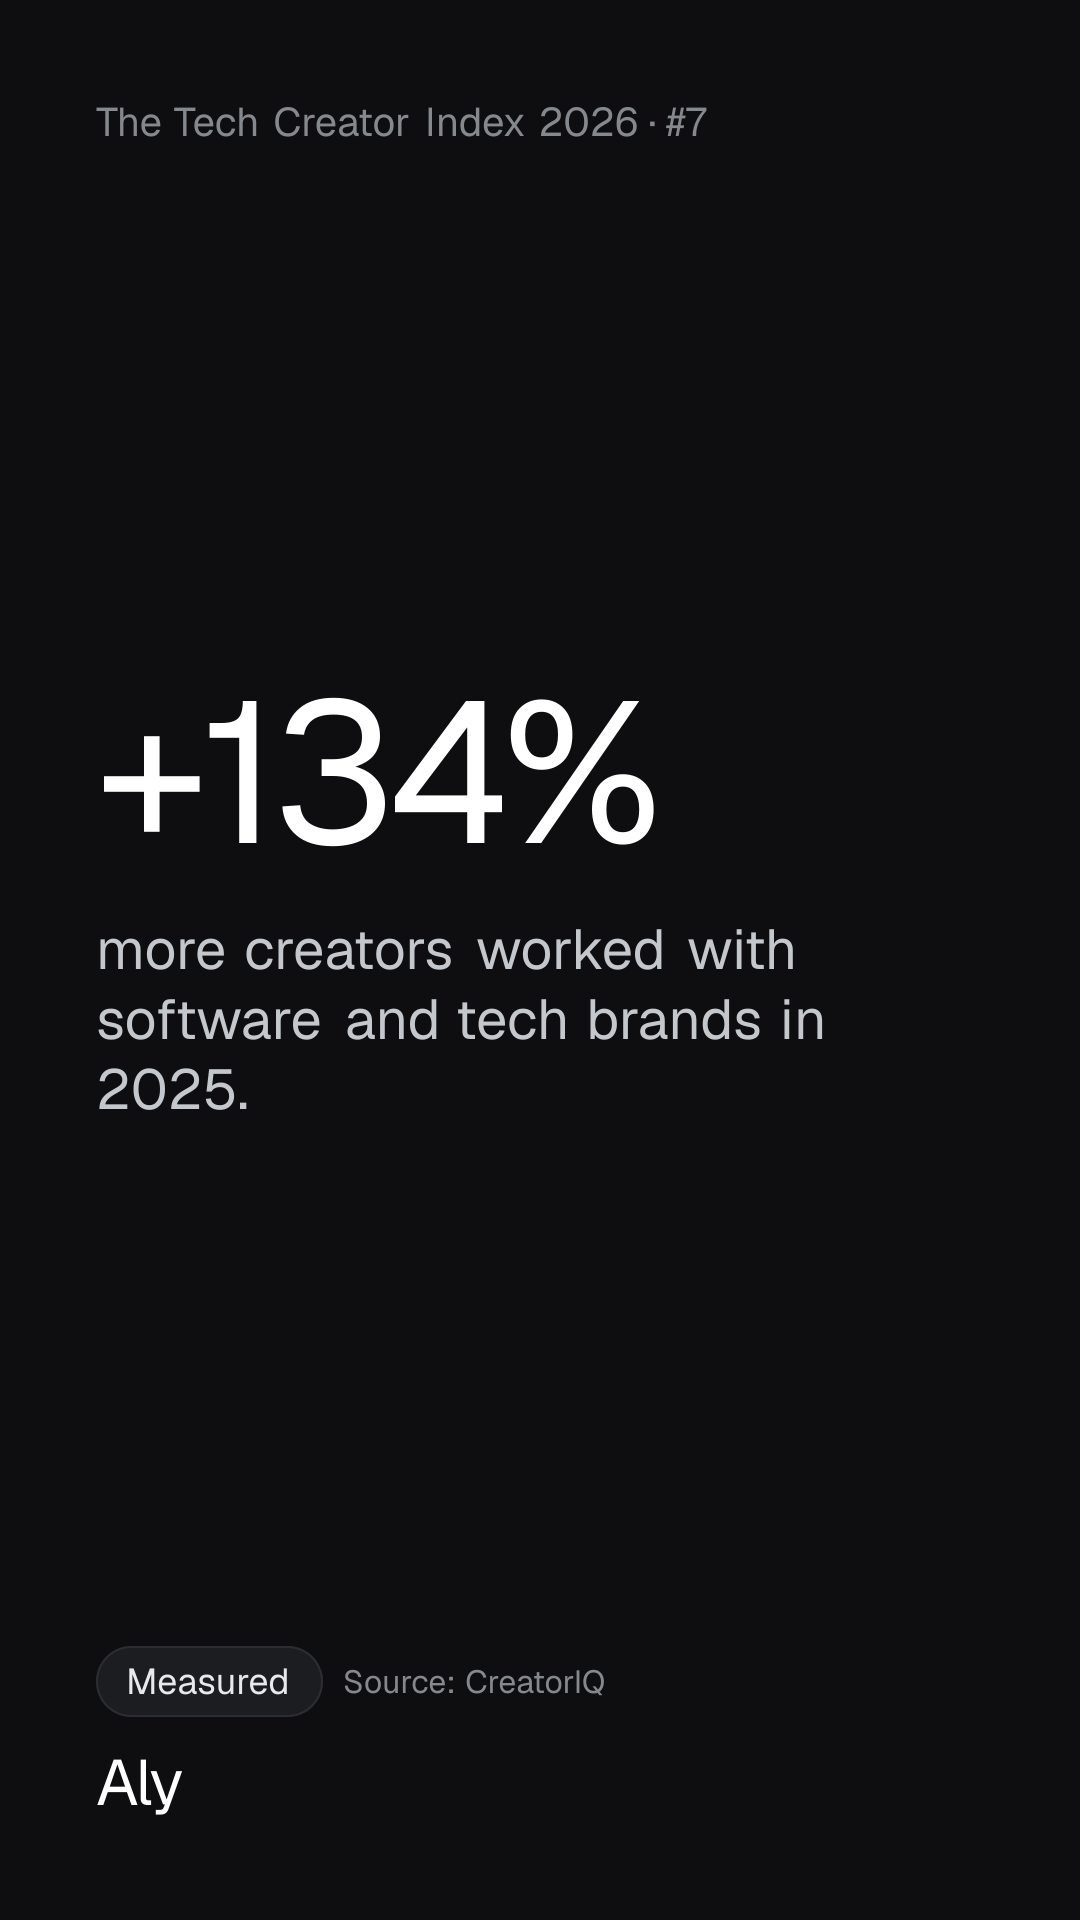
+134%

more creators worked with software and tech brands in 2025. Software & tech ranked #1 of 15 industries. Standouts: ChatGPT, Google Gemini, Substack.

Tech brands more than doubled the creators they work with. Demos and explainers are the job.

The top 100 brands per industry, by CreatorIQ's own earned-media model.

Source: CreatorIQ · 25 Feb 2026

Growth in creators per industry, 2025

#1of 15 industries

Data and method

CreatorIQ, 2025 Creator Economy Report: Top Industries, Hottest Brands, 25 Feb 2026. Vendor data.

Growth in creators per industry, 2025
Rank
Software & tech#1 of 15
8WorldwideAly data

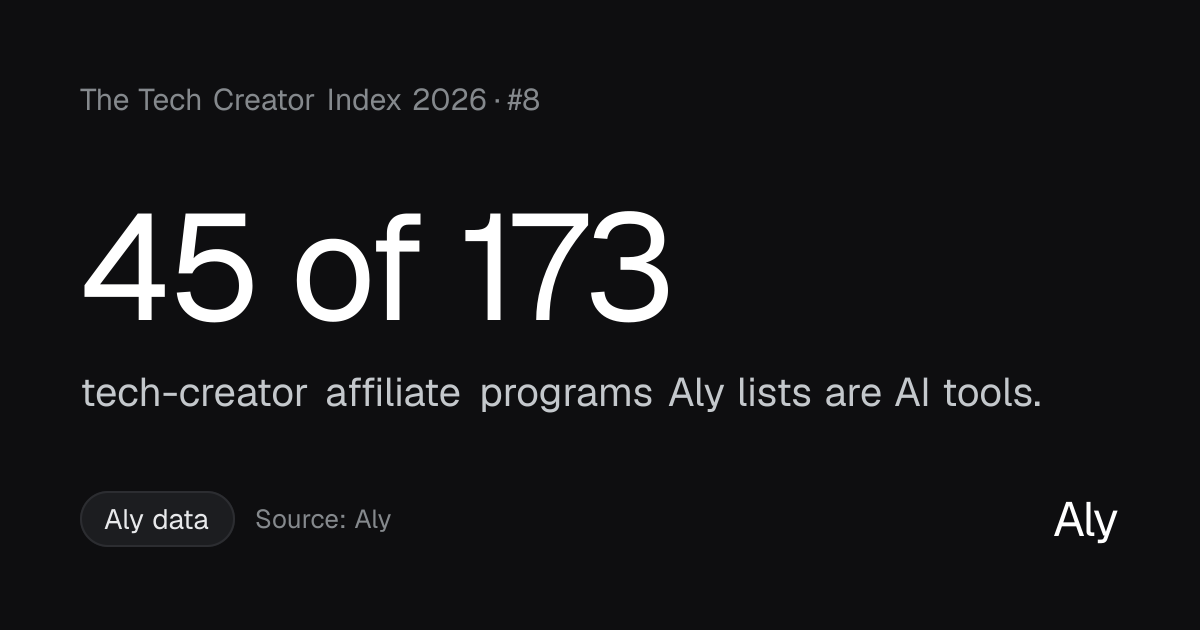
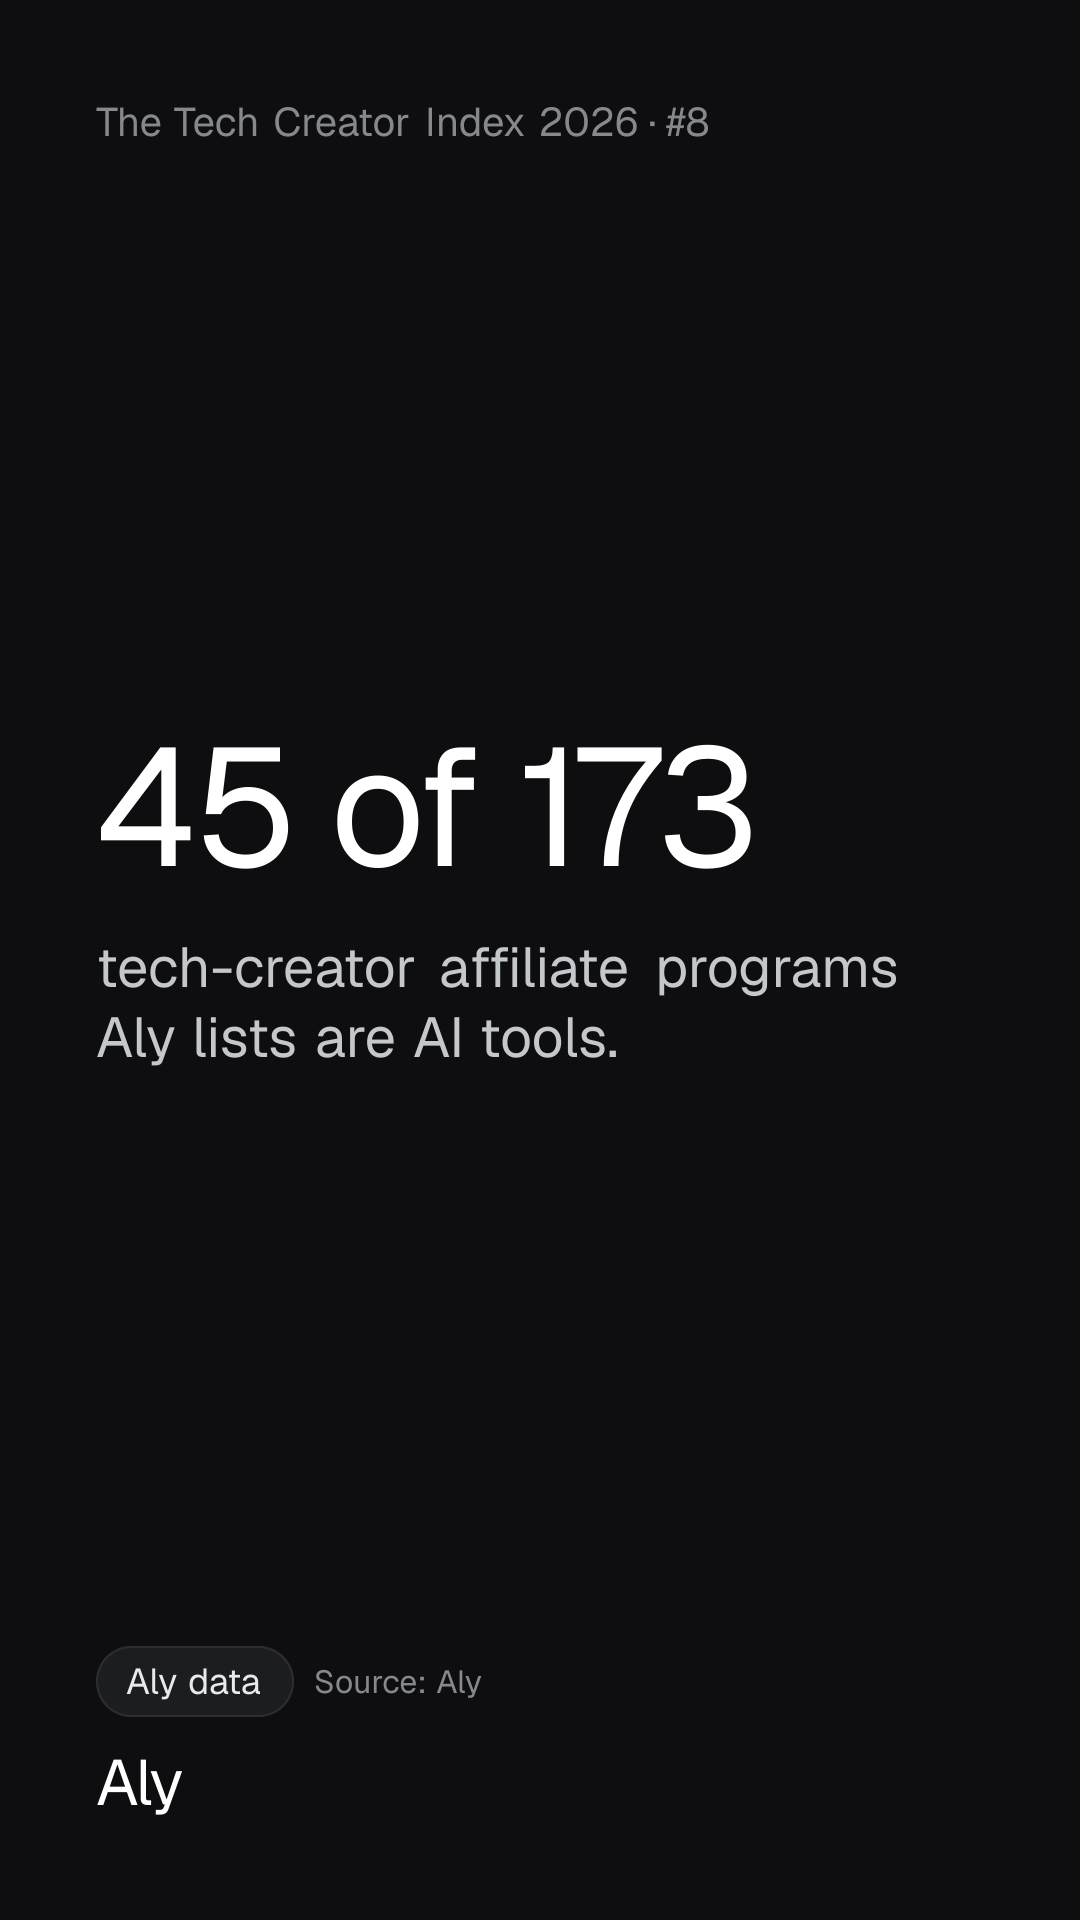
45 of 173

tech-creator affiliate programs Aly lists are AI tools. 60% pay on renewals, not just the first sale. Median headline commission: 30%.

In tech, one good recommendation can pay for a year.

Churn: 14 of the 214 programs Aly read had closed or couldn't be confirmed (about 1 in 15).

Curated for tech creators, not a census of every program.

Source: Aly · 9 Oct 2026

The 173 programs, one square each
AI tools (45) of 173Everything else (128) of 173
AI tools (45)Everything else (128)
How long each program pays
One paymentOne payment: 51513 to 36 months3 to 36 months: 5555Recurring or lifetimeRecurring or lifetime: 4949Not statedNot stated: 1818
Data and method

Aly, Affiliate programs for tech creators (CC BY 4.0), 9 Oct 2026. Primary (Aly's own reading of each program's page).

“Headline” is a program's own highest stated rate.

The 173 programs, one square each
Programs
AI tools (45)45
Everything else (128)128
How long each program pays
Value
One payment51
3 to 36 months55
Recurring or lifetime49
Not stated18

Numbers 9–11

Small is strong

9WorldwideMeasured

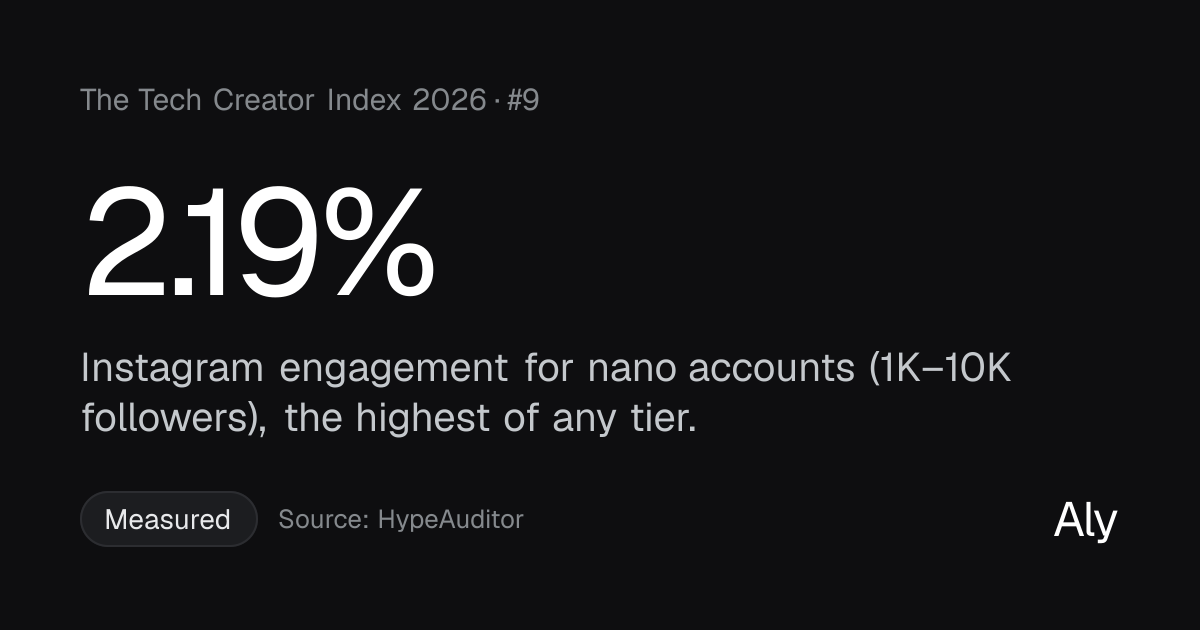
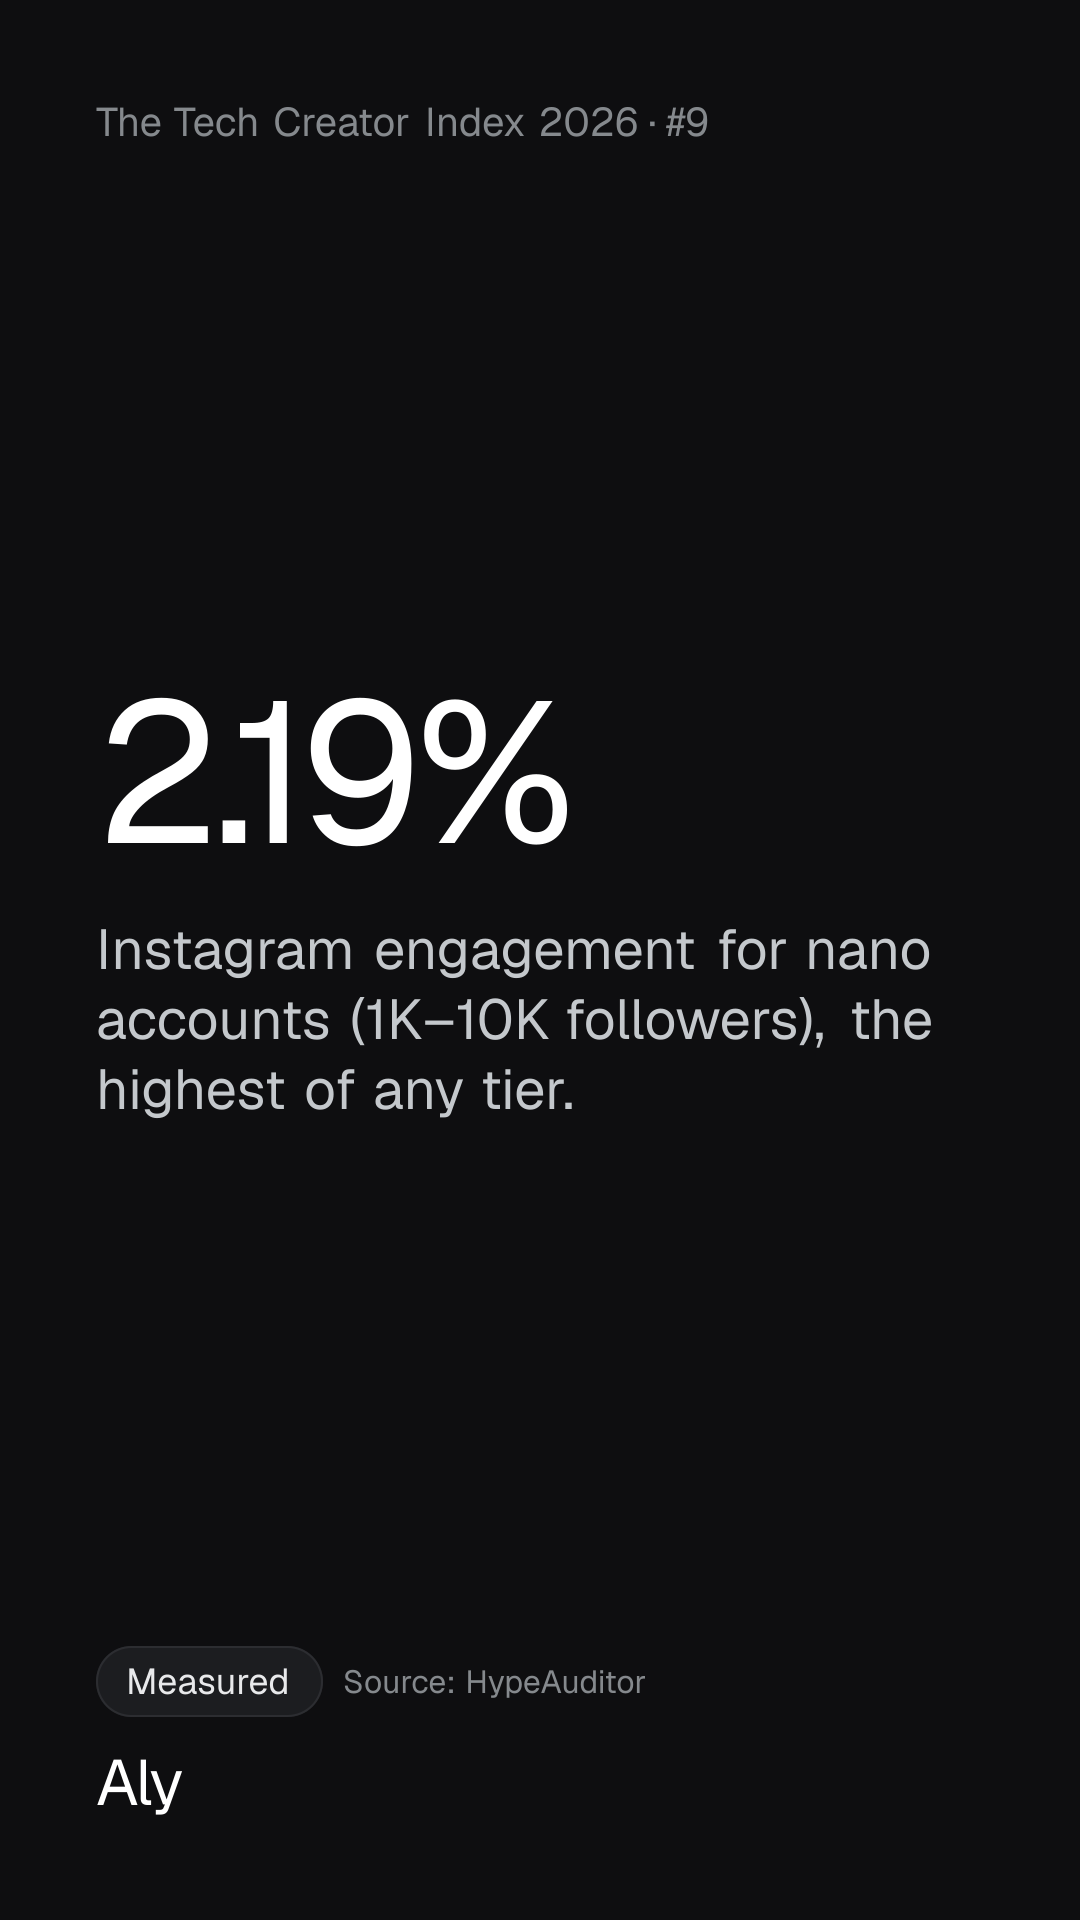
2.19%

Instagram engagement for nano accounts (1K–10K followers), the highest of any tier. Nano accounts are 76% of Instagram creators.

You don't need a million followers to matter to a brand.

Engagement rate as HypeAuditor defines it.

Source: HypeAuditor · 2025

Data and method

HypeAuditor, State of Influencer Marketing 2025, 2025. Vendor data.

2024 data, worldwide.

10WorldwideSurvey

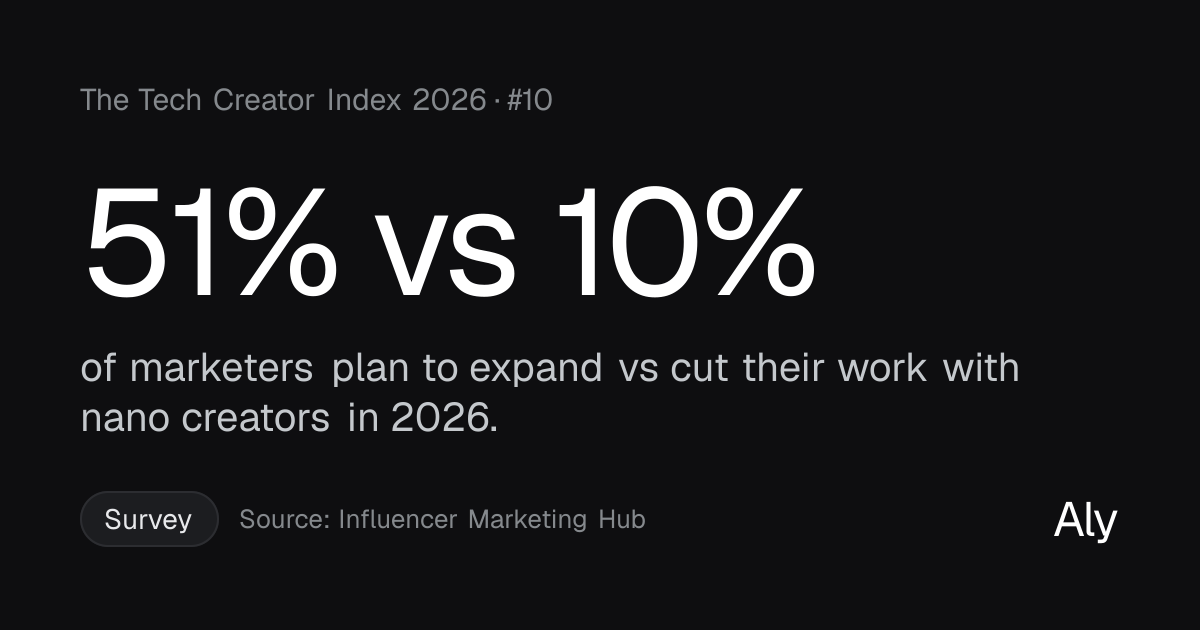
51% vs 10%

of marketers plan to expand vs cut their work with nano creators in 2026. For micro creators, 53% plan to expand. The share cutting isn't published.

Budgets are moving toward smaller creators.

Plans, not spend.

Source: Influencer Marketing Hub · 4 May 2026

Marketers' 2026 plans for work with small creators
NanoNano, Cut: 10%10%Nano, Expand: 51%51%Micron/aMicro, Expand: 53%53%
CutExpand
Data and method

Influencer Marketing Hub, Influencer Marketing Benchmark Report 2026, 4 May 2026. Vendor survey (600+ respondents).

Mostly global respondents.

Marketers' 2026 plans for work with small creators
CutExpand
Nano10%51%
MicroNot published53%
11WorldwideMeasured

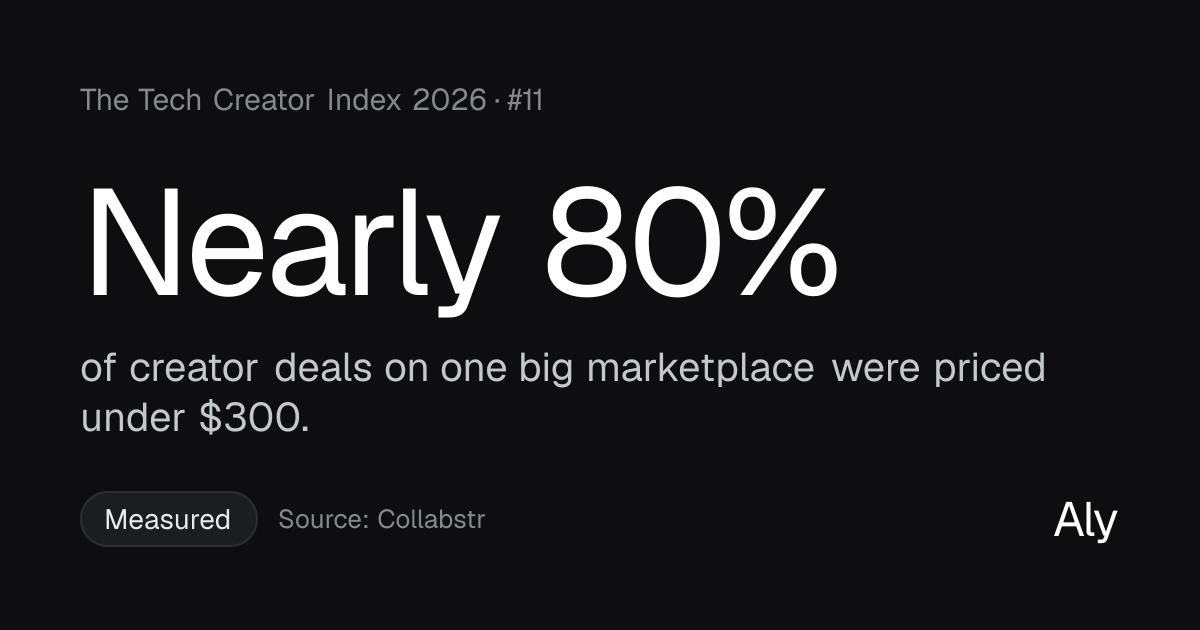
Nearly 80%

of creator deals on one big marketplace were priced under $300. Average paid: YouTube $255, Instagram $193, TikTok $186.

Most deals are small. The business is repeat brands and income you own.

A marketplace for small deals, so it skews low.

Source: Collabstr · Mar 2026

Ten deals, by price
Under $300$300 or more
Data and method

Collabstr, 2026 Influencer Marketing Report, Mar 2026. Vendor data (21,000+ marketplace collaborations), via Storyboard18.

Ten deals, by price
Out of 10 deals
Under $300About 8
$300 or moreAbout 2

Number 12

What Aly measured

12Aly data

Link-page speed

Being re-measured with 10 public pages per platform. It joins this page when the run is done.

The honest part

It isn't easy, and it isn't for everyone. Treat it like a business, and use numbers like these to run it.

Method

One number per question, from its original source wherever one exists. Where Aly computed a figure from an official series, its “Data and method” says so and names the series. Third-party figures were read on their sources on 10 Oct 2026; the affiliate numbers are recomputed from Aly's directory each time this page is built, last read 9 Oct 2026.

Measured
Counted from records or tracked activity: an official series, a company's own figure, or a vendor's database.
Projection
A forecast, or a figure published before its period ended.
Survey
What people said they plan or think. Intent, not spend.
Aly data
Aly's own measurement, from its own files. Aly is an interested party: it says so.

Left out

  • “73% of brands favour micro over macro”: attributed to Influencer Marketing Hub, not in its report.
  • A “Linktree State of the Creator” report with “250 million creators” and a “$34,000 median full-time income”: no Linktree page carries either.
  • Canadian creator ad spend (about US$660 million in 2025): a model estimate, not comparable with IAB's US figure.
  • A 72% figure for brands expecting budgets to rise 50% or more: implausibly aggressive, from a survey of intent.

The data

Every number on this page, one row each, with its badge and its source. Free to use under CC BY 4.0: credit the original source, and Aly as compiler.

How to cite

Name the original source first, then this page. Each number has its own citation in its “Share” menu. For the whole edition:

Aly (2026). The Tech Creator Index 2026. aly.bio/index/2026. Data CC BY 4.0. Cite each number's original source first.

Changelog

  • First edition, US and Canada. Stat 12 (link-page speed) joins after its re-run with 10 pages per platform.

Aly is a link-in-bio for tech creators. See Aly